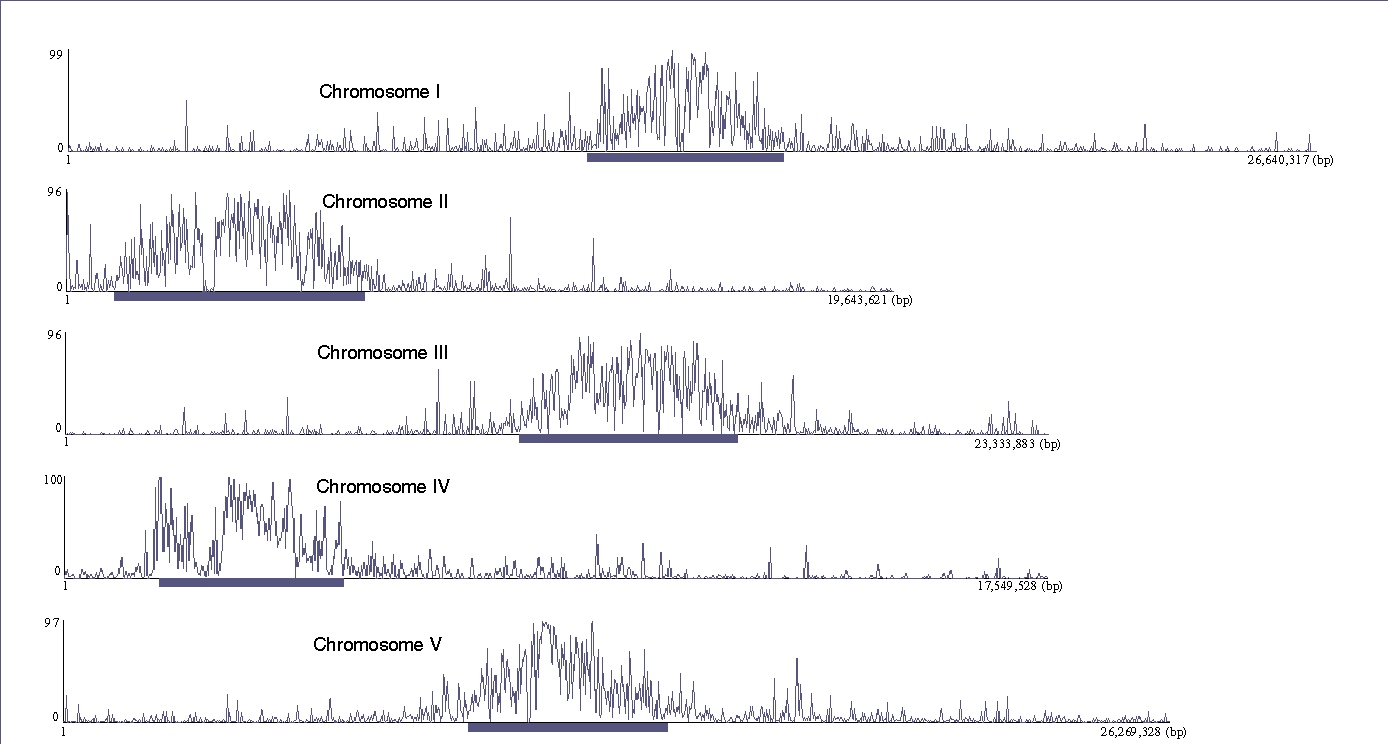
Figure 1. Distribution of transposable
and repetitive elements in the A. thaliana chromosomes.
Paracentromeric regions are marked by blue reactangels.
Percentage of DNA classified as transposable elements
is calculated in a 25-kb sliding window moved along
the chromosomes (minimum and maximum percentage values
are indicated).
Reference:
Kapitonov, V.V. and Jurka, J. (2002) Distribution of transposable and repetitive
elements in the A. thaliana chromosomes,
www.girinst.org/server/TransPub